|
|
2 anos atrás | |
|---|---|---|
| .ipynb_checkpoints | 2 anos atrás | |
| data | 2 anos atrás | |
| Airbnb.ipynb | 2 anos atrás | |
| Airbnb公开数据集-北京市数据分析.md | 2 anos atrás | |
| README.md | 2 anos atrás | |
| cn_stopwords.txt | 2 anos atrás | |
| simhei.ttf | 2 anos atrás |
README.md
Airbnb公开数据集-北京市数据分析
作业内容
商务智能技术主要用于对商业数据进行分析,以提高商业决策的准确性和效率。
本次作业选择的数据集是 Airbnb 的公开数据,需要根据分析目标,选择合适的算法进行分析,并编写代码实现。分析过程中,需要进行数据清洗和预处理,并结合实际情况利用可视化操作、回归分析等方法进行数据分析。最后,需要结合实际情况对分析结果进行解读和讨论。
分析目的
目的是对北京地区民宿的分布,受欢迎词条分析和可视化展示,以期对北京民宿市场的理解提供指导
数据集下载
在 Airbnb 公开数据 中找到 Airbnb 的公开数据。选择合适的数据集,下载到本地。这里选择了Airbnb于21 June, 2022公布的Beijing相关数据,如下图:
数据集初探
导入相关库文件
import numpy as np
import pandas as pd
读取listings.csv文件
listing = pd.read_csv("data\listings.csv")
查看数据集基本情况
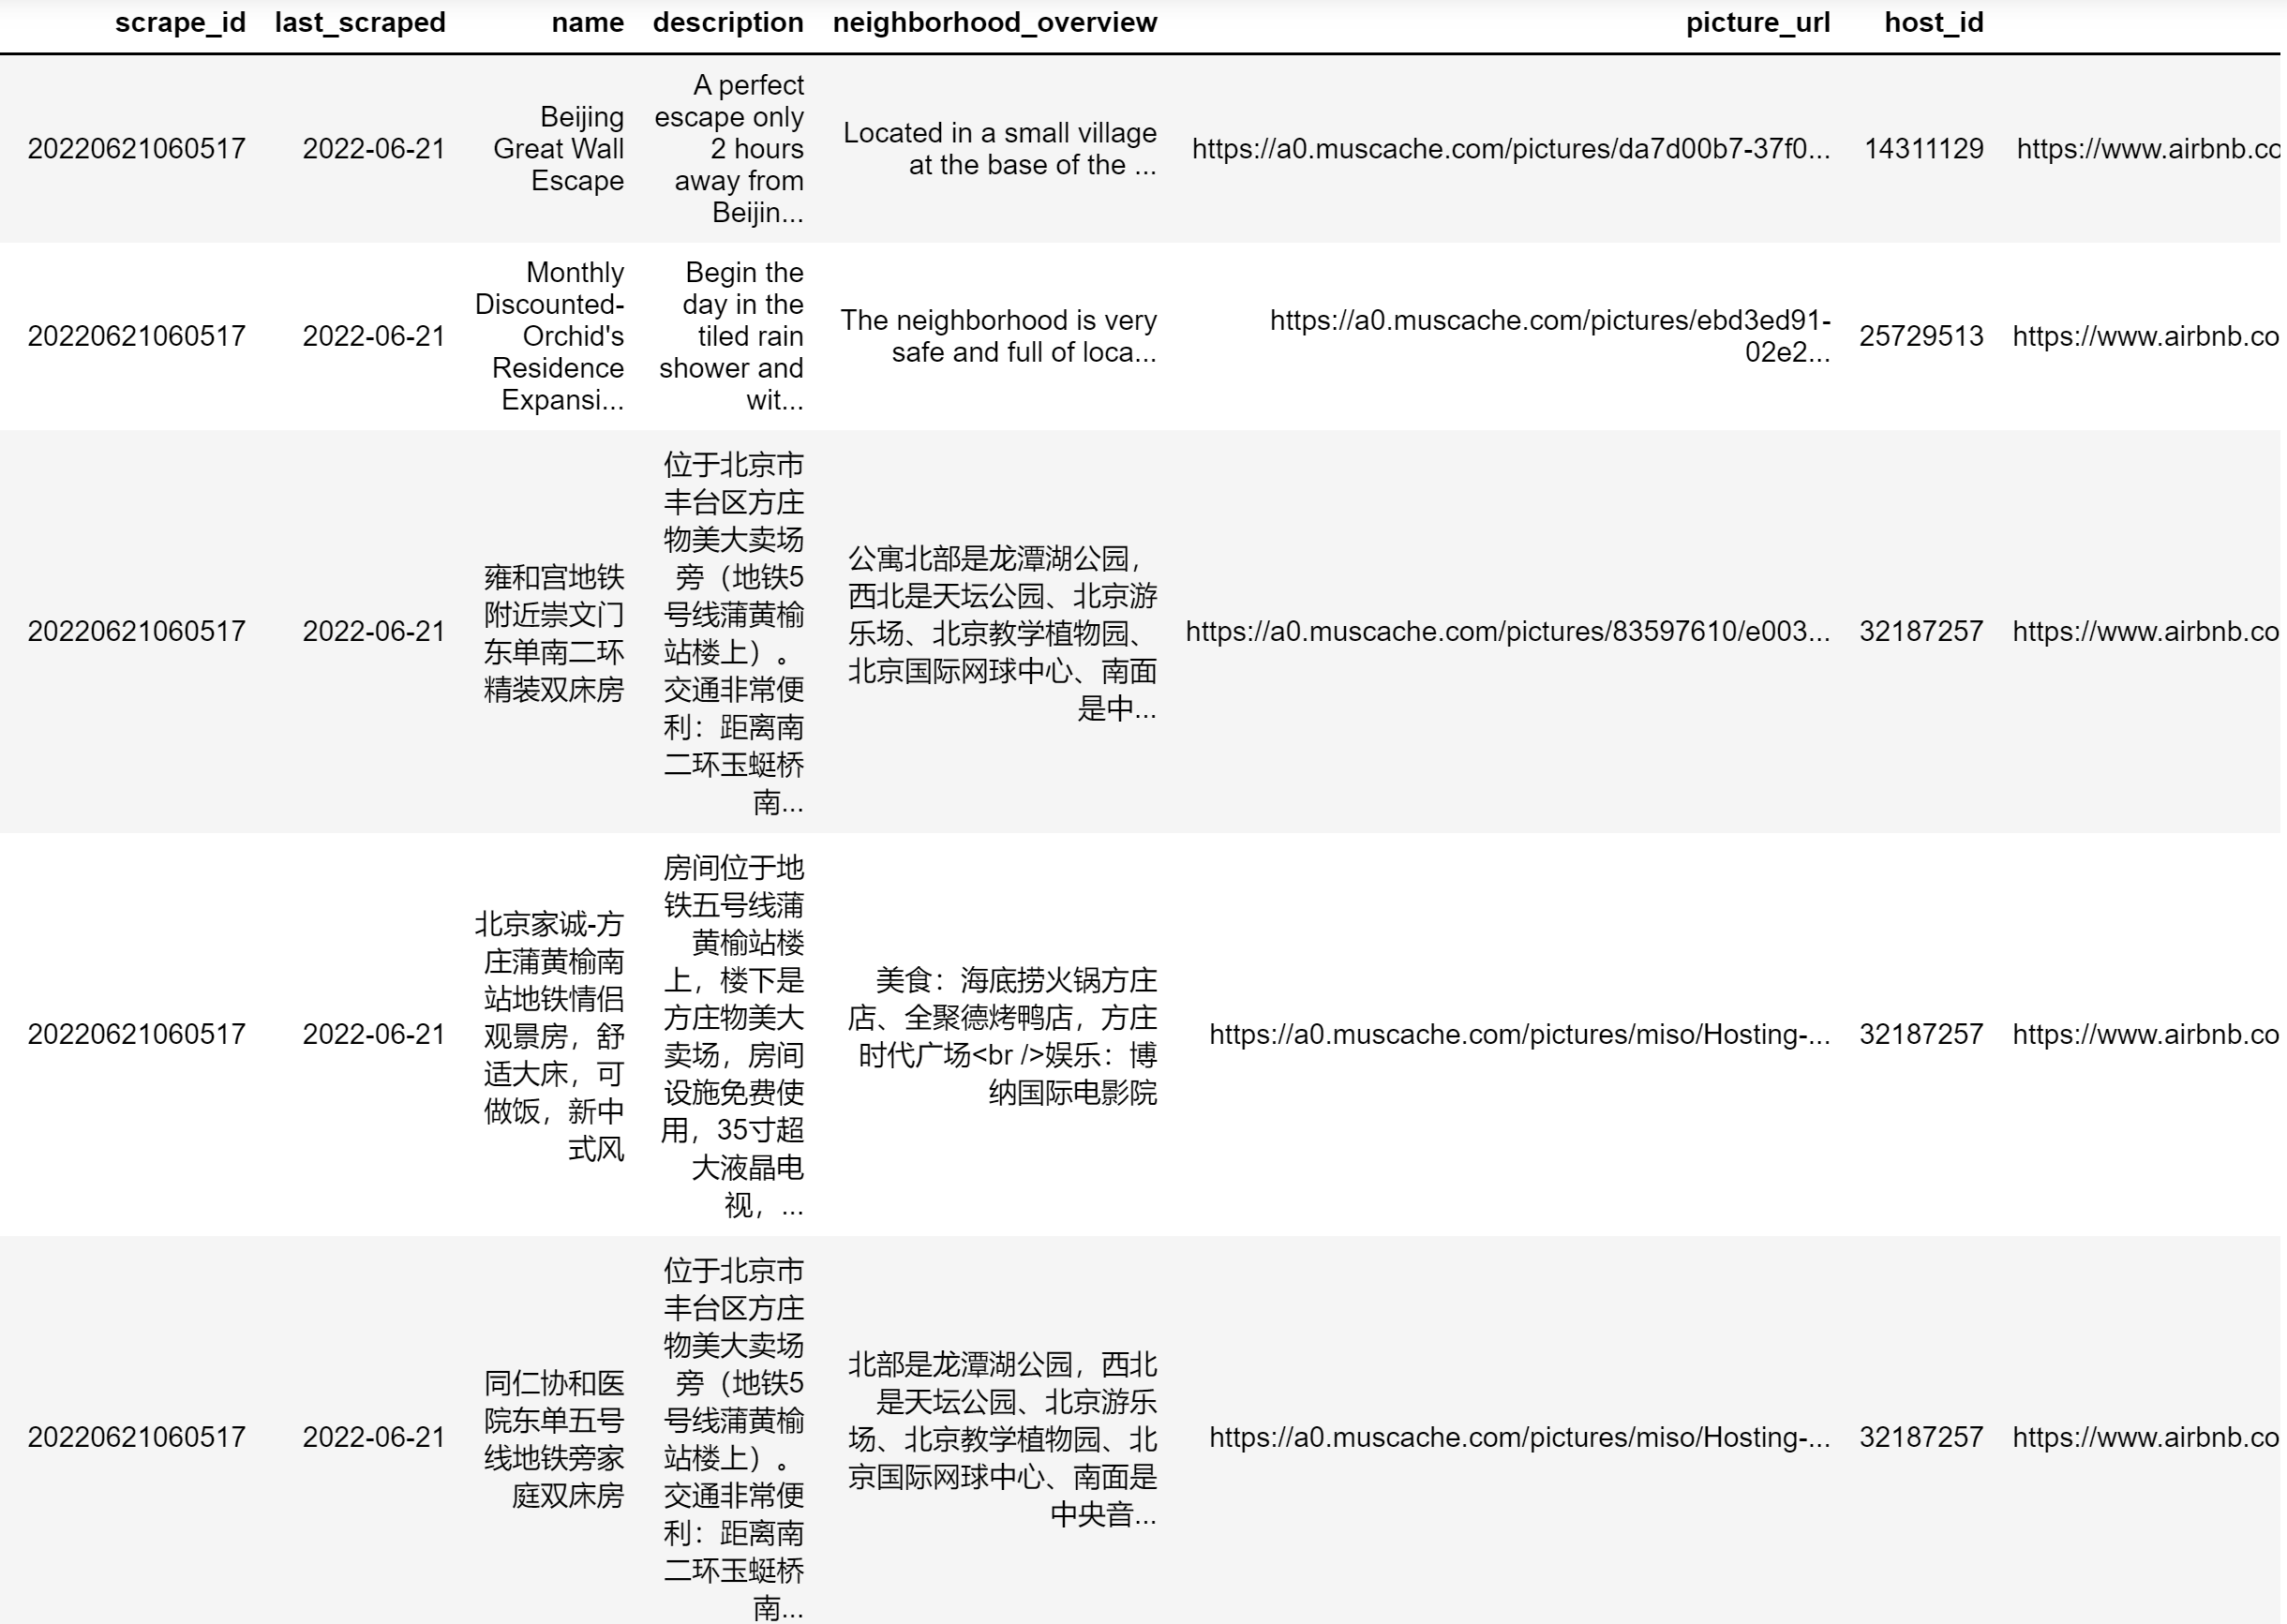
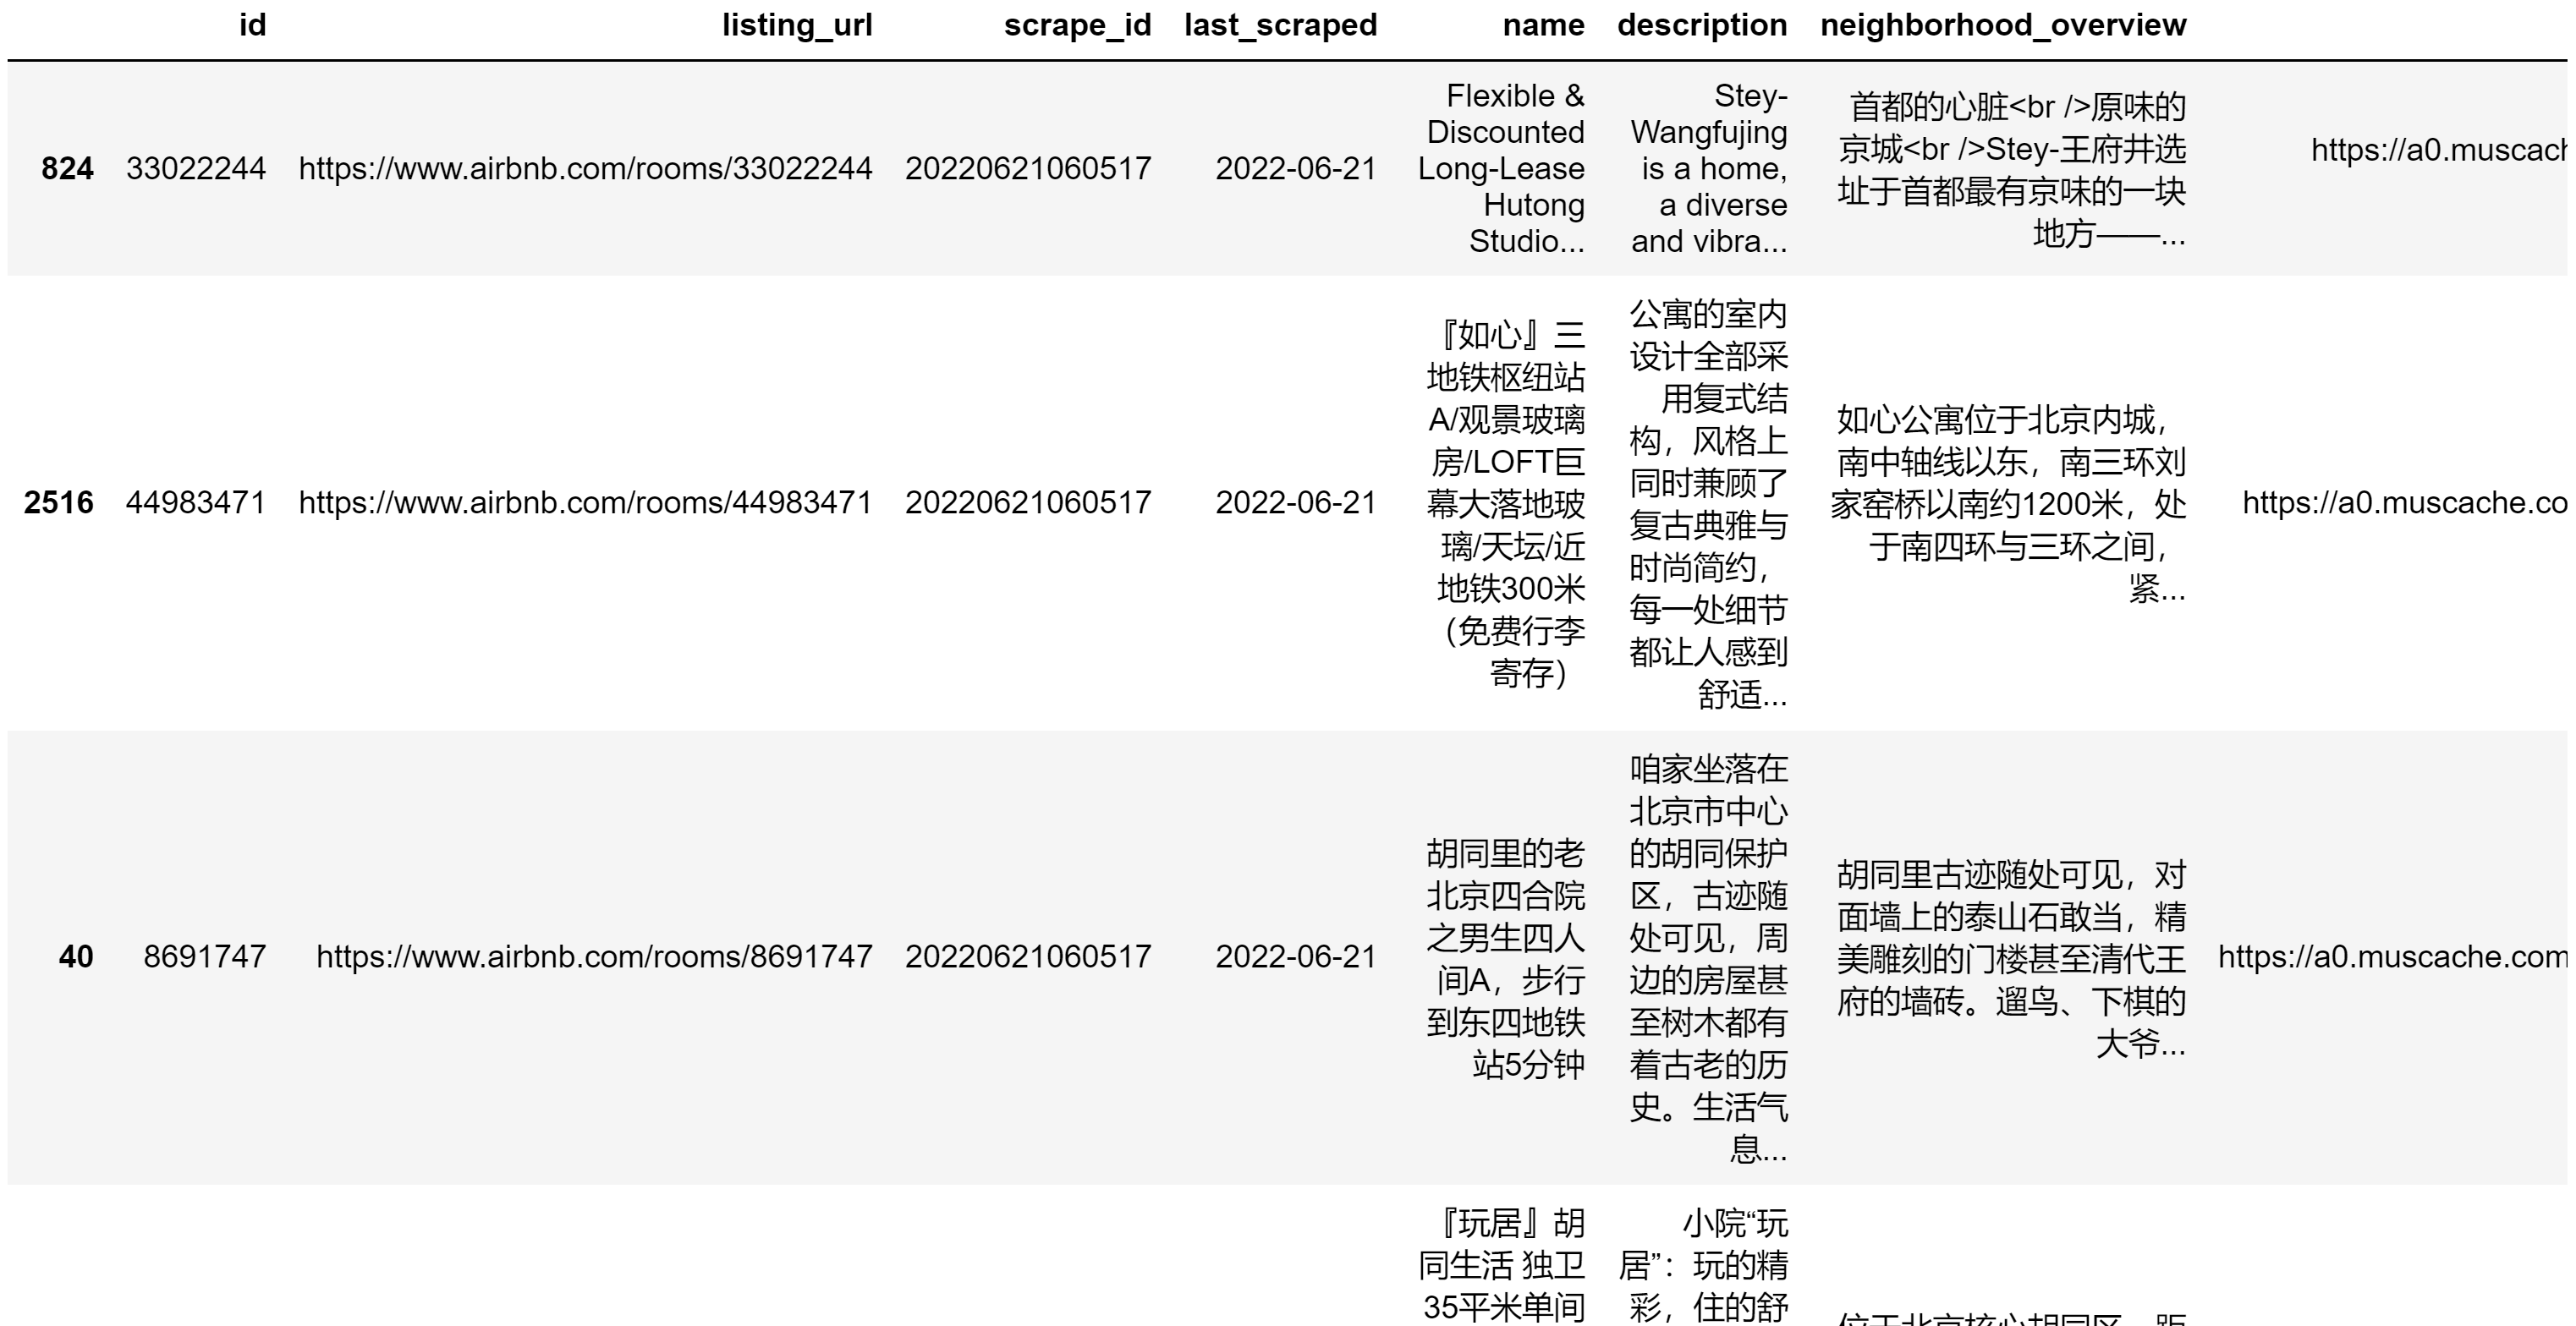
listing.head()
输出如下
查看info统计情况
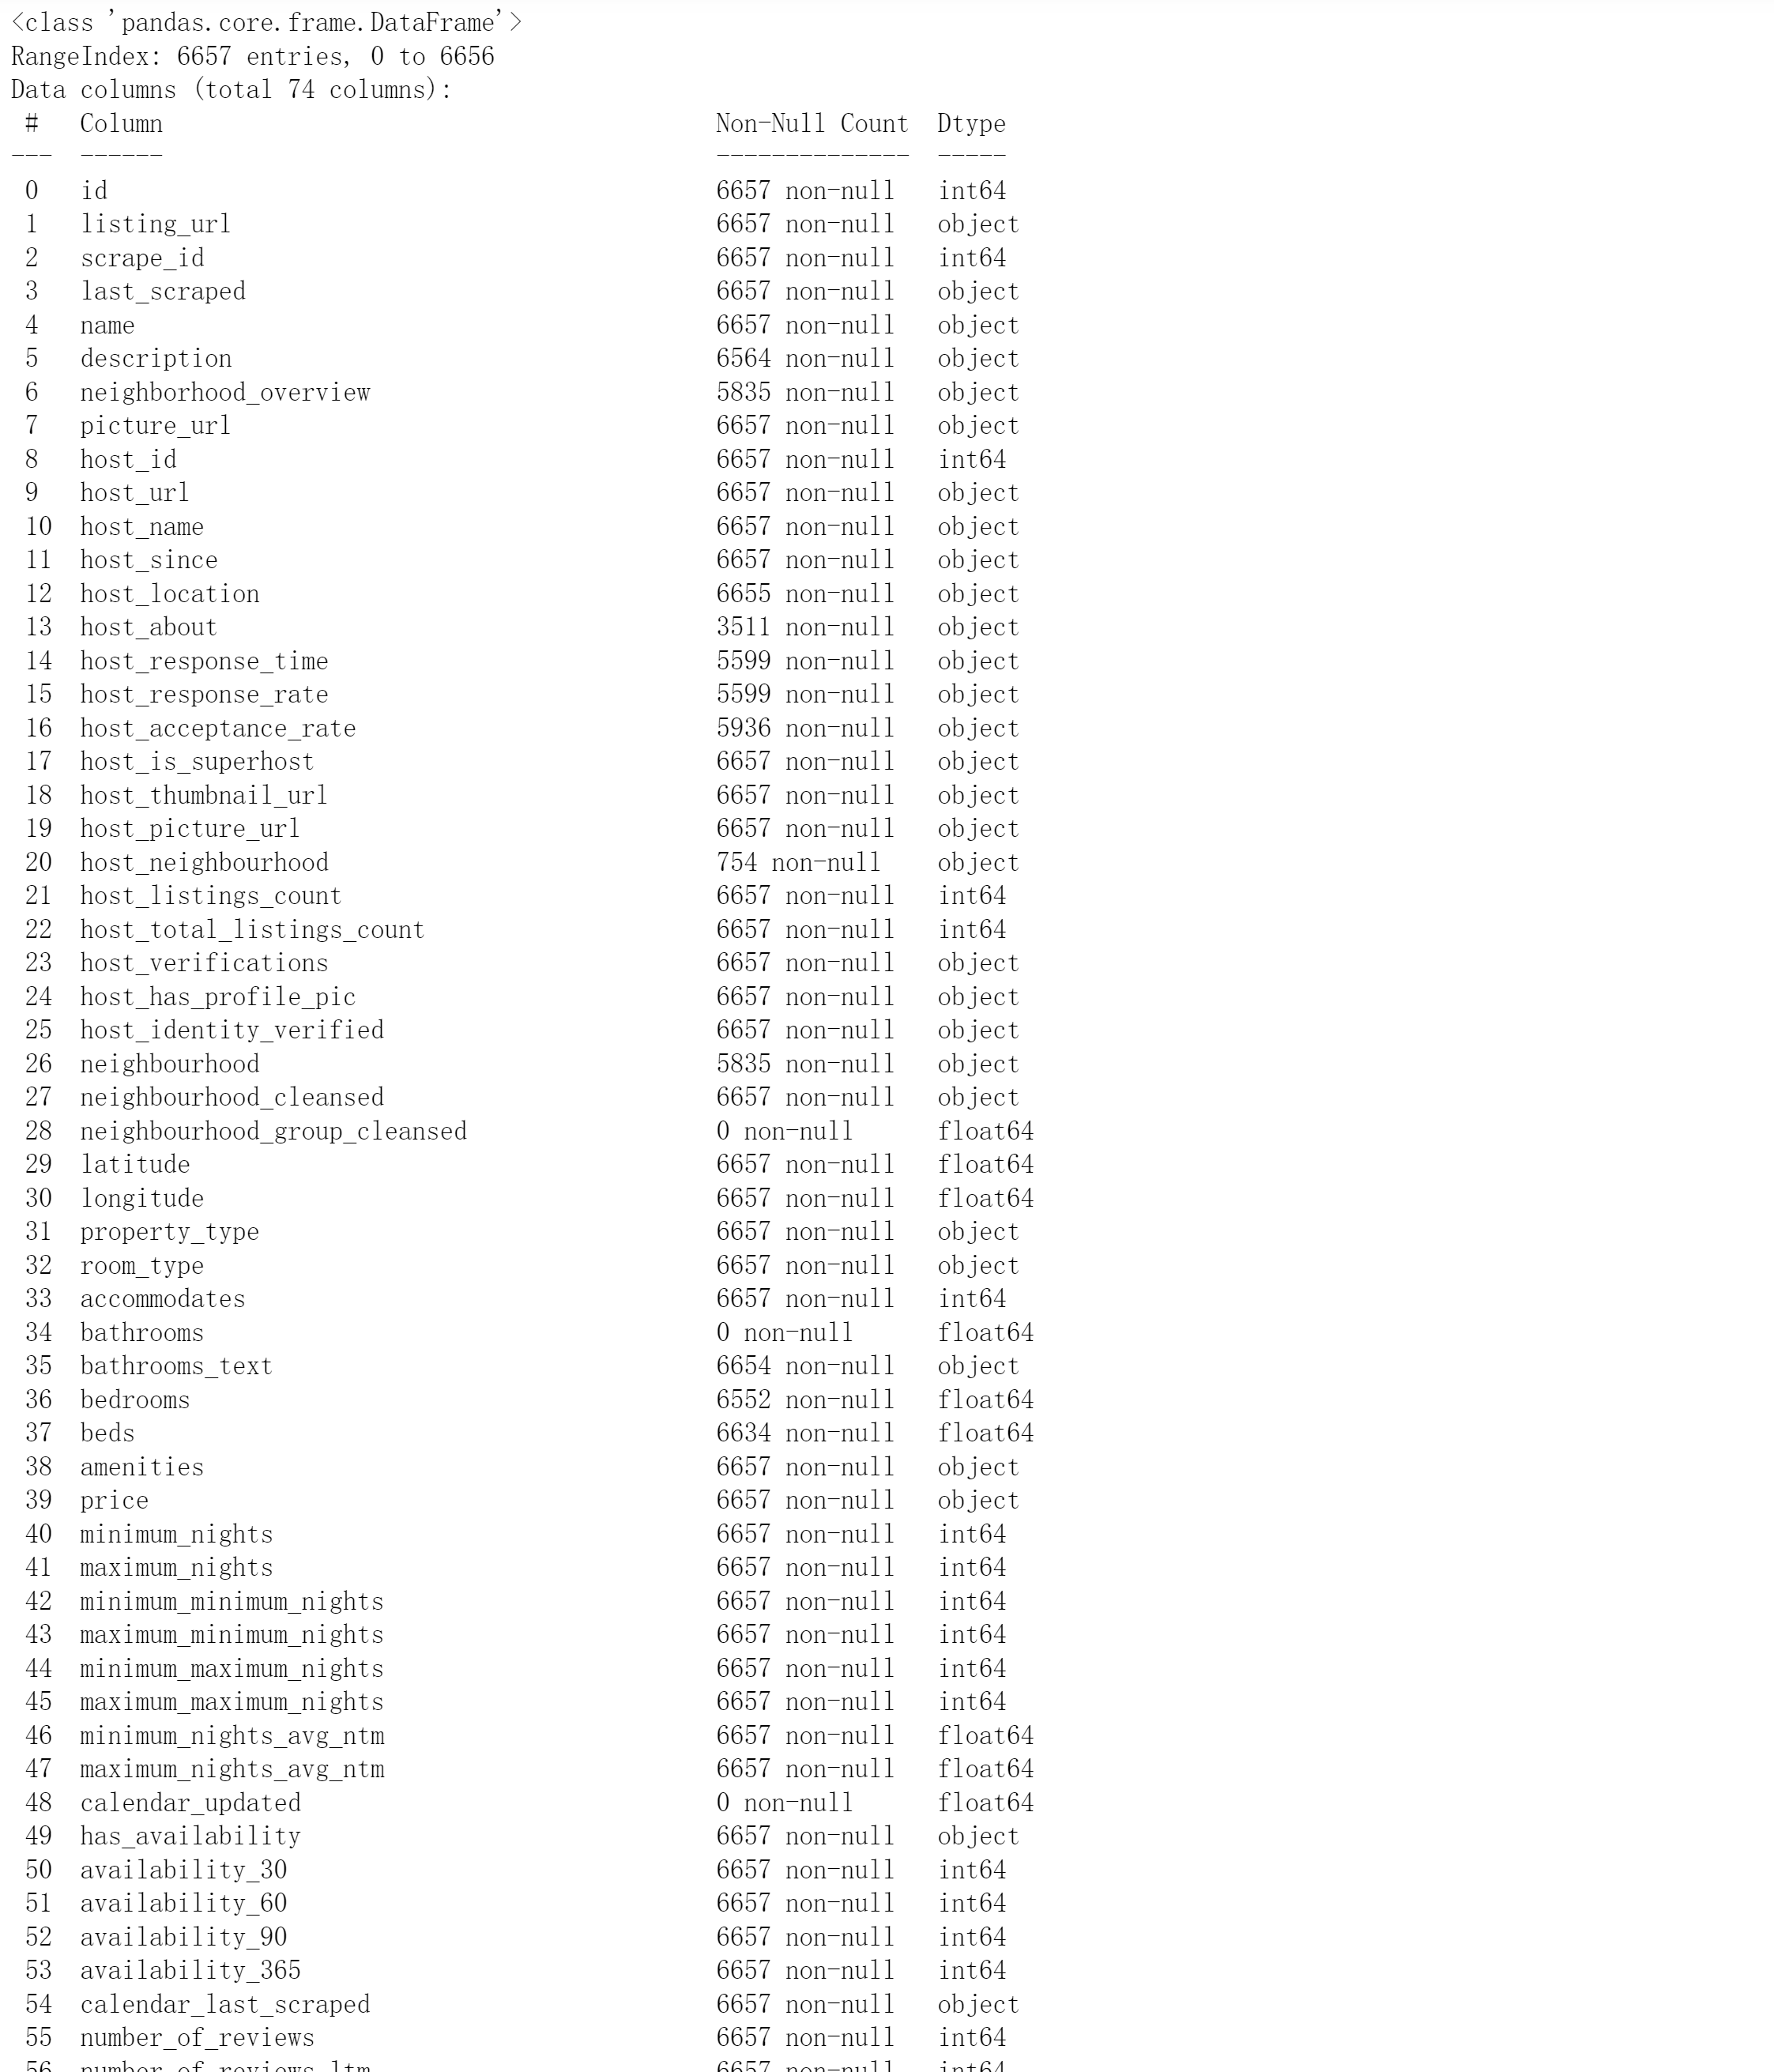
listing.info()
输出如下
可以看到其中有部分feature数据丢失,因此需要手动选取对于分析较为有价值的feature;同时有部分数据格式不方便处理,为object格式,需要预处理
数据预处理
对price进行预处理,转换为float64格式
# 预处理price,将object数据转化为int格式
def convert_currency(var):
    """
    convert the string number to a float
    _ 去除$
    - 去除逗号,
    - 转化为浮点数类型
    """
    new_value = var.replace(",","").replace("$","")
    return float(new_value)

listing["price"] = listing["price"].apply(convert_currency)
数据分析
连续性字段
把连续性字段拿出来形成一张新的表格,然后对其进行描述性分析
new_columns = ['price','minimum_nights','number_of_reviews','calculated_host_listings_count','availability_365']
data = listing[new_columns]
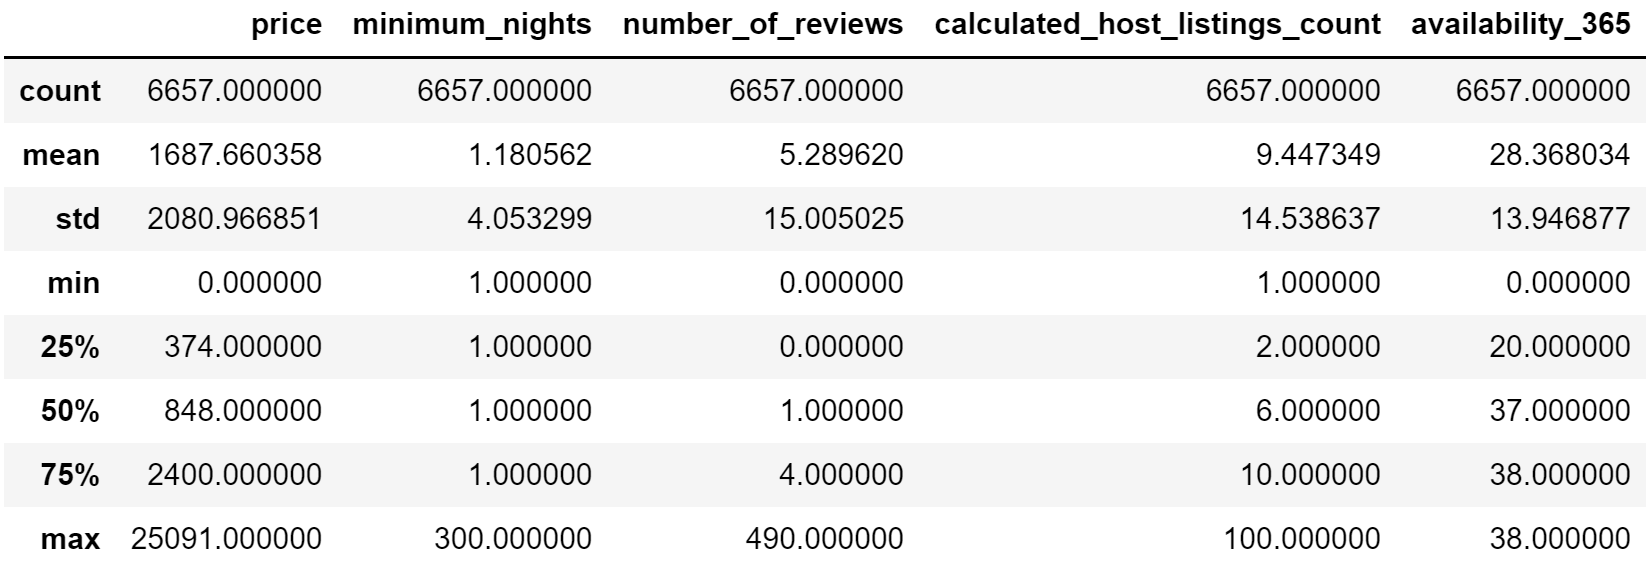
data.describe()
输出如下
通过连续型特征观察各个字段的分布,我们可以得出:
- price价格分布较广,平均为1690美元左右,中位数为848美元
- minimum_nights(客人最少入住天数)大部分为1天,少数要求较高
- calculated_host_listings存在一些极大值,表明一些房主是二房东运营着多套房子
- number_of_reviews存在极大值,可能要注意是否存在雇佣水军刷评论的现象
民宿分布
import matplotlib.pyplot as plt

# 民宿分布分析
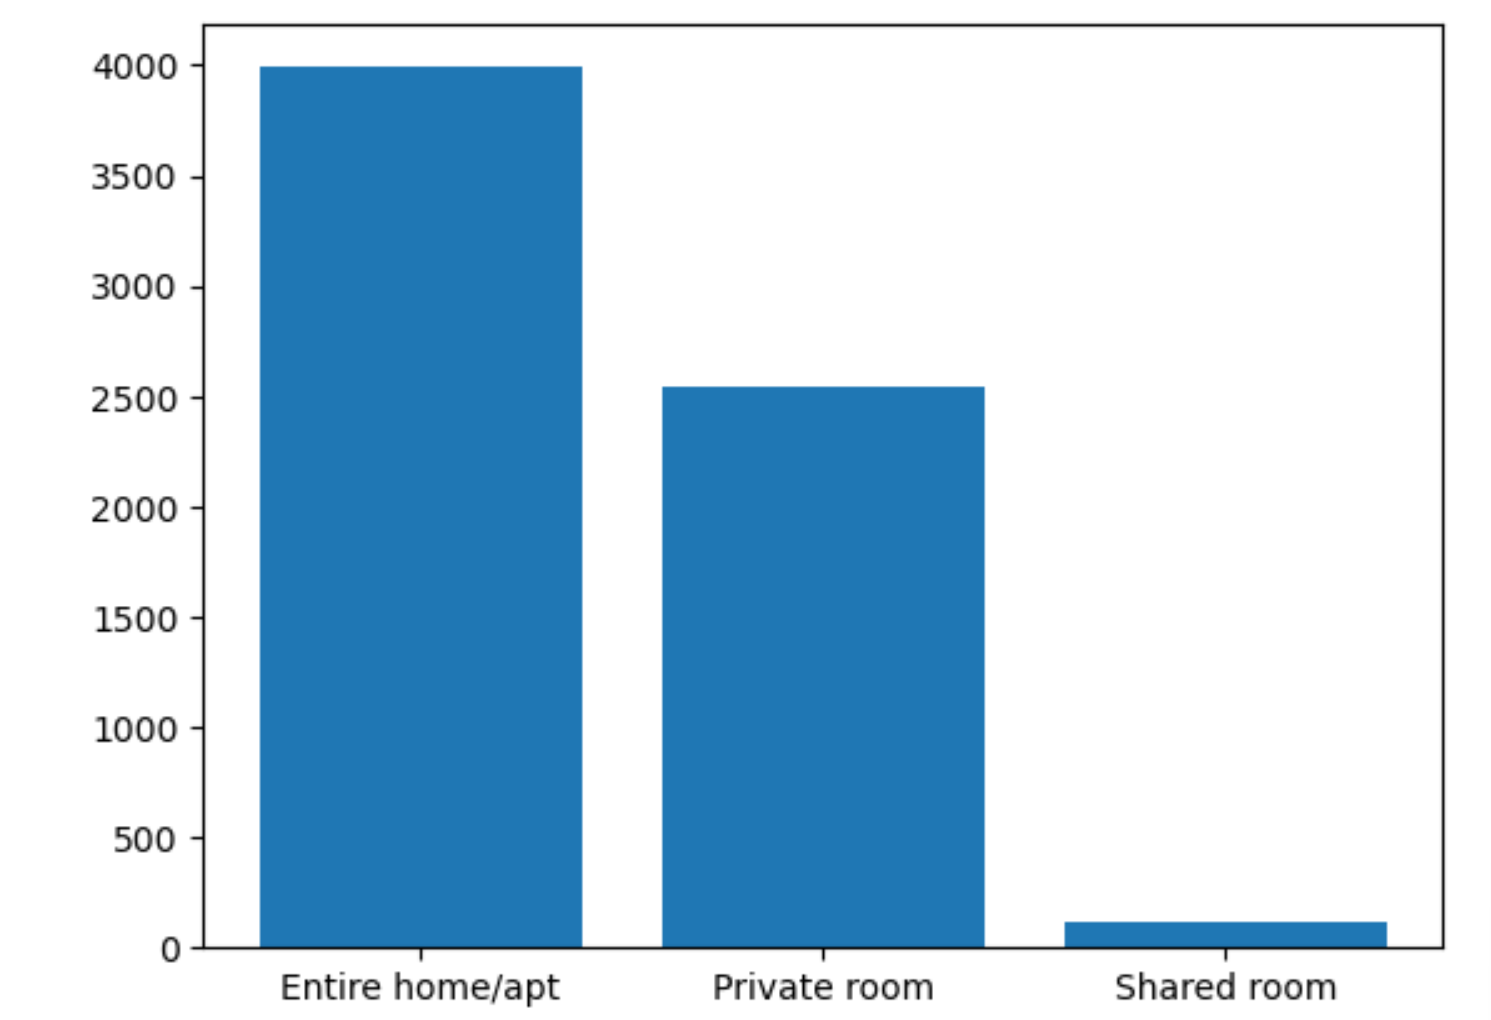
data = listing['room_type'].value_counts().tolist()
a = listing['room_type'].unique()
plt.bar(x=a, height=data)
可以发现大多数都是整租,很少有人合租
房东统计
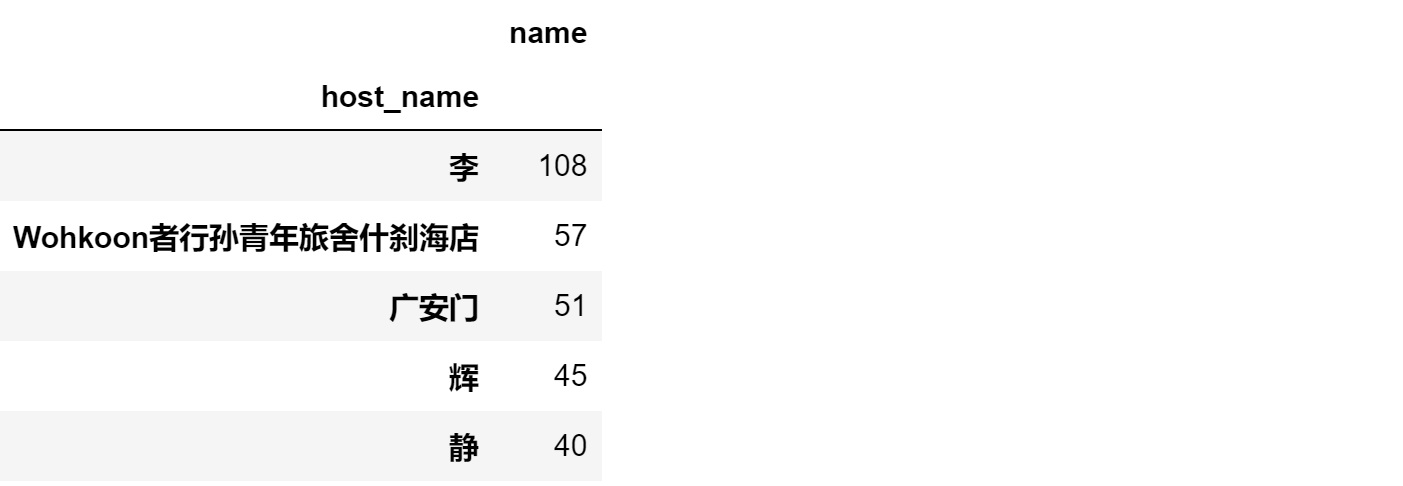
listing[['host_name','name']].groupby('host_name').count().sort_values(by='name',ascending=False).head()
可以看到host_name相对集中,印证了上文面连续型中calculated_host_listings中得出的结论
民宿分布位置
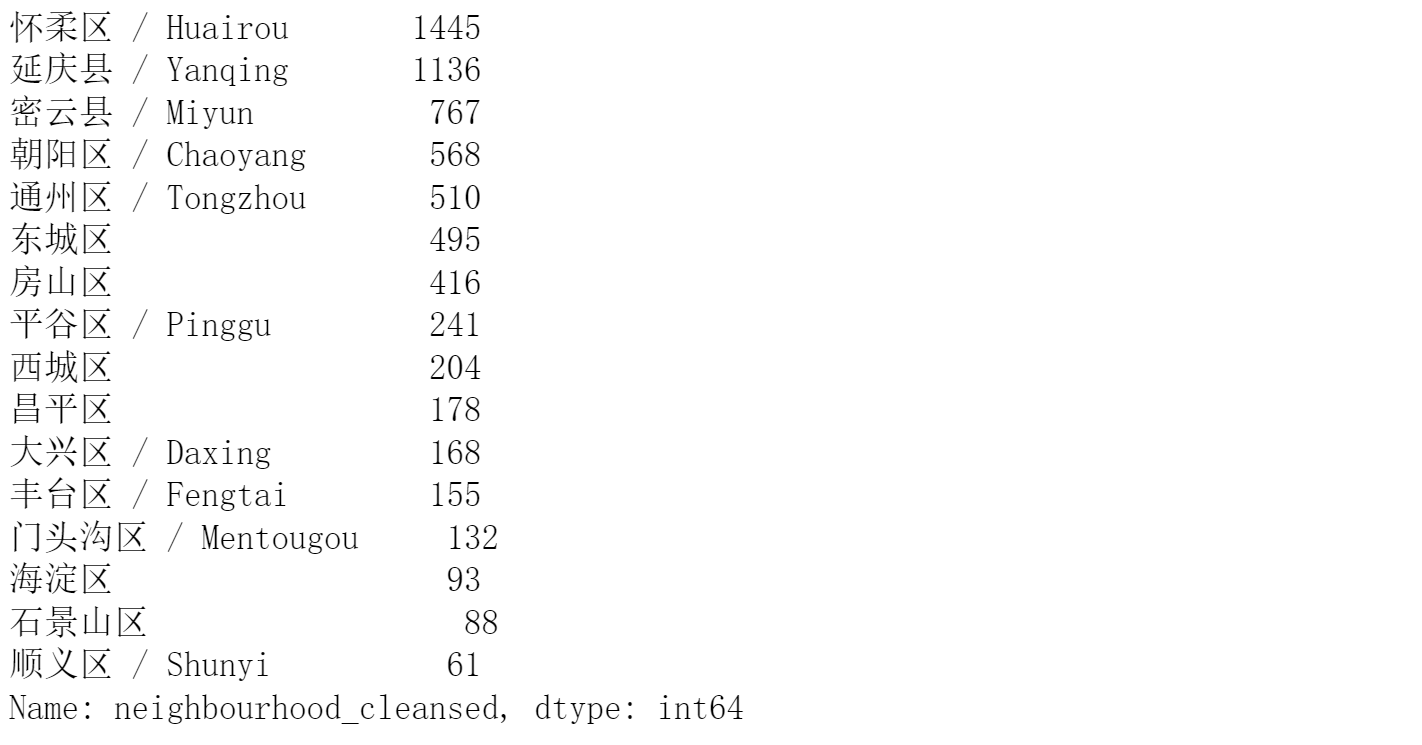
listing['neighbourhood_cleansed'].value_counts()
可以看出不同区域民宿分布差距较大
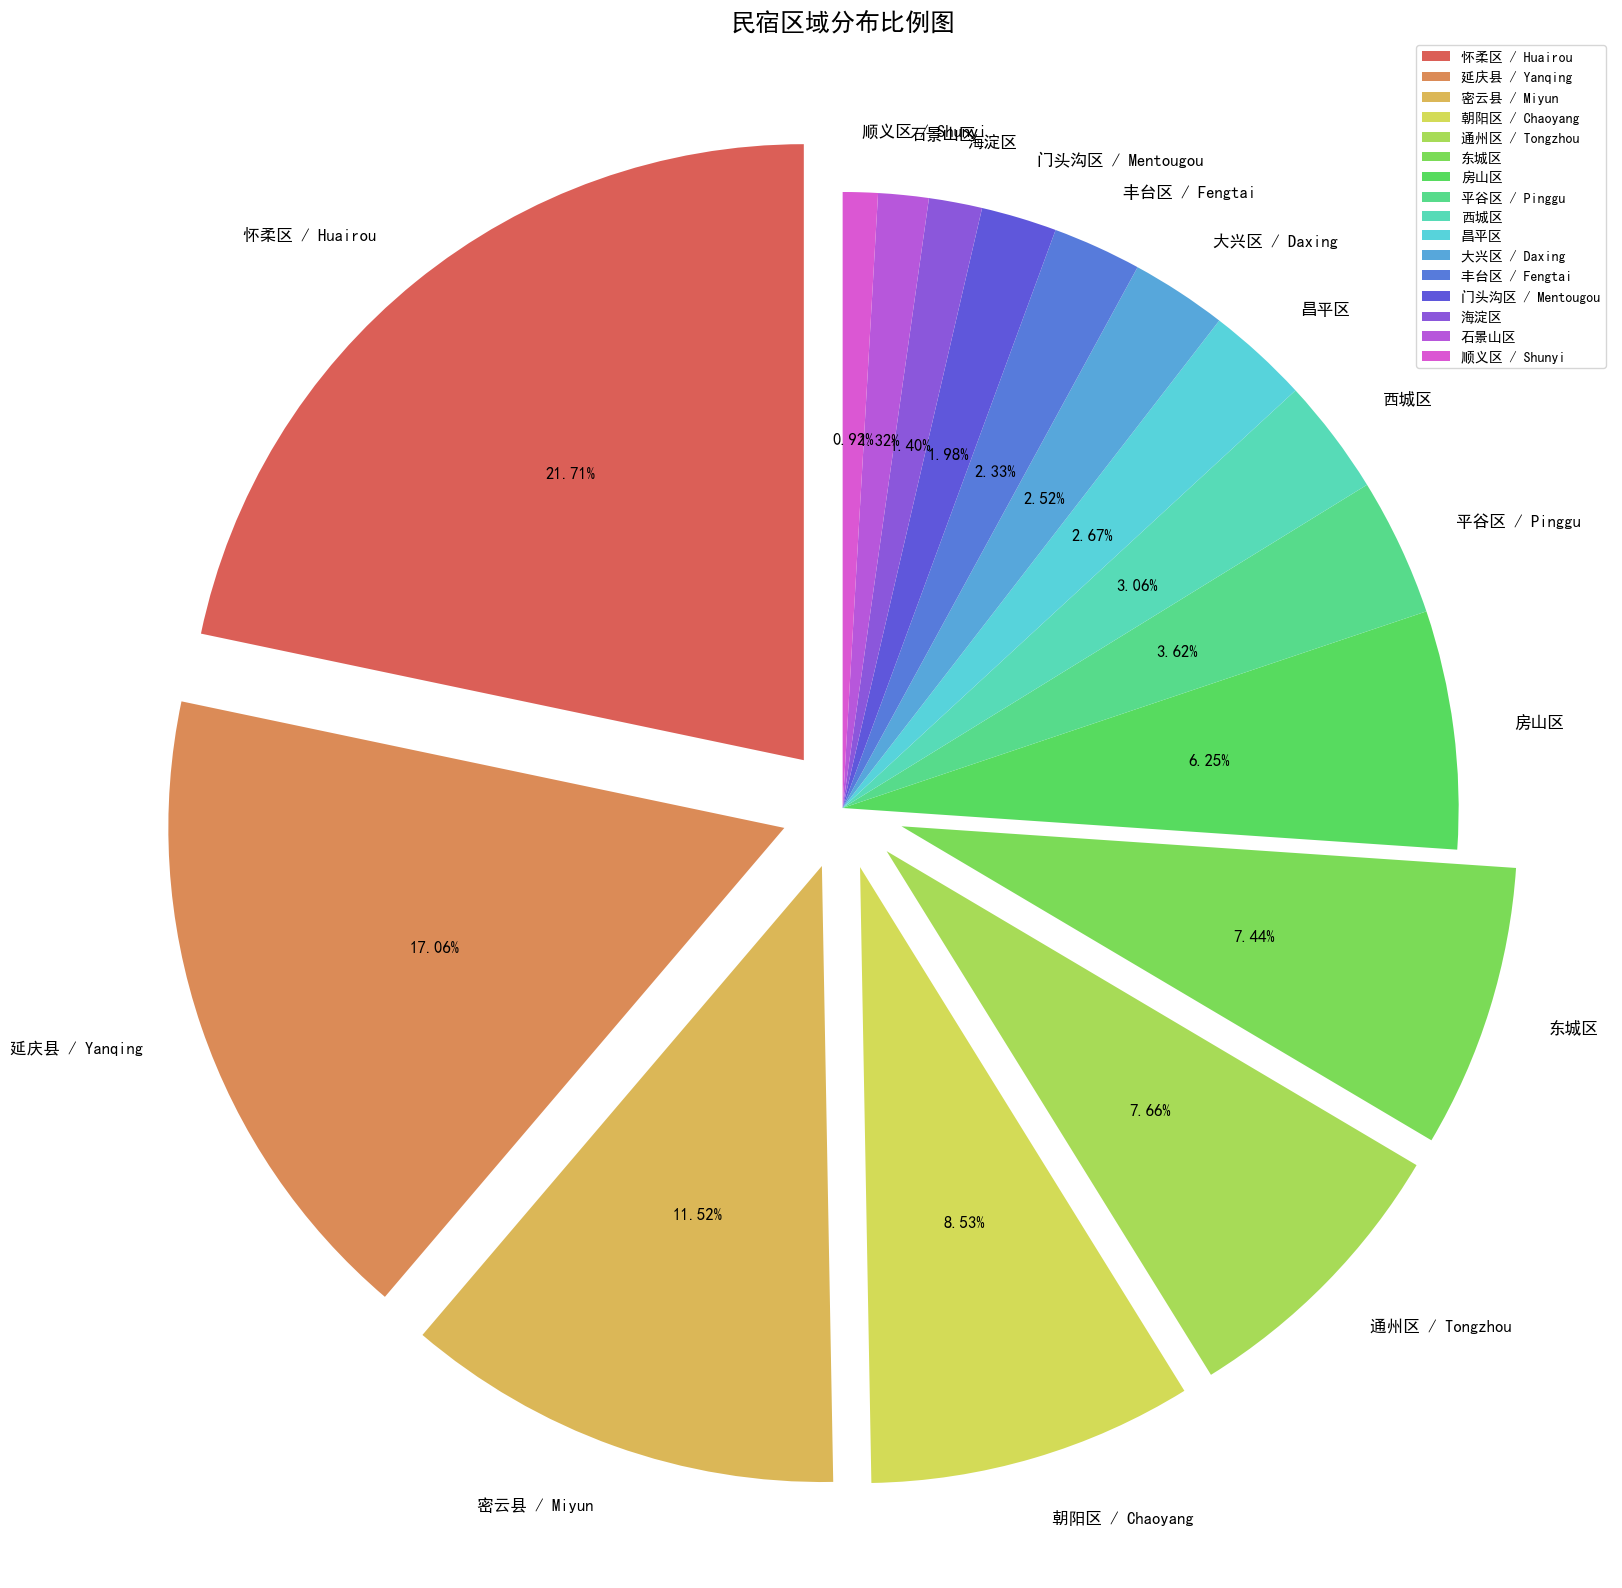
民宿分布比例可视化
定义一个查看哪些区域超过了平均民宿数量来用作饼图的参数分配
def explode_situtation(data):
    explode = {}
    for i in range(len(data)):
        if data[i]>data.mean():
            explode[data.index[i]] = 0.1
        else:
            explode[data.index[i]] = 0
    return explode


explode = list(explode_situtation(listing.neighbourhood_cleansed.value_counts()).values())
使用plt进行可视化
import seaborn as sns

data2 = listing.neighbourhood_cleansed.value_counts()
plt.figure(figsize=(20,20))
plt.title('民宿区域分布比例图',fontdict={'fontsize':18})
plt.pie(data2,labels=data2.index,autopct='%.2f%%',explode=explode,startangle=90,
       textprops={'fontsize':12,'color':'black'},colors=sns.color_palette('hls',n_colors=18))
plt.legend()
输出如下
可以看出民宿分布集中在怀柔、延庆、密云、朝阳等区,可能是由于这些区域旅游业相对发达
分析价格情况
价格初探
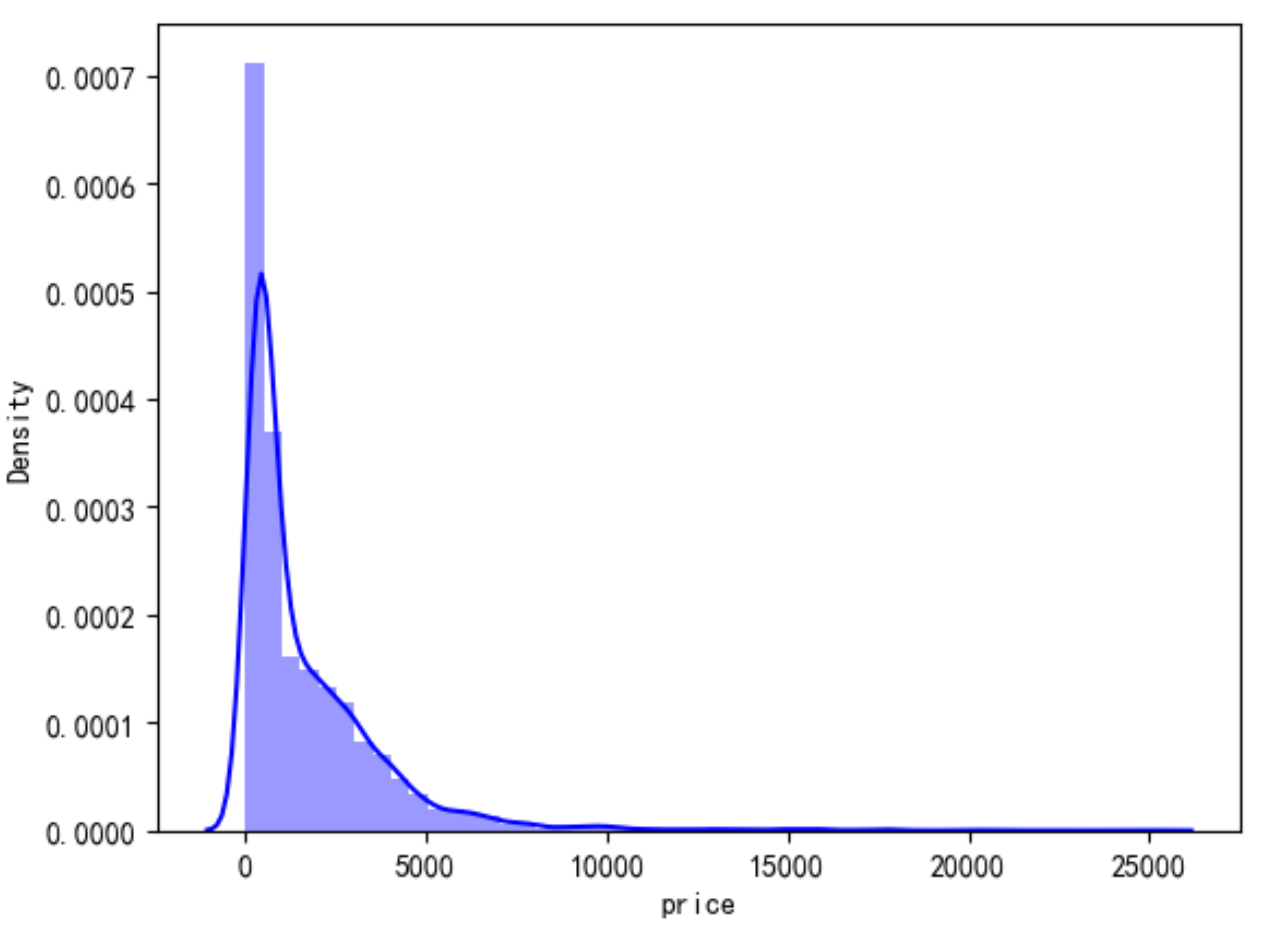
首先需要查看价格的基本情况,是否有异常值需要预处理
# 查看价格情况
sns.distplot(listing['price'],color='b')
可以看到有部分民宿房价有0的情况,查看一下房价为0的数据
price_is_0 = listing[listing['price']==0]
price_is_0
输出如下
清除异常数据
drop_index_list = price_is_0.index.tolist()
listing_dealt = listing.drop(drop_index_list)
listing_dealt[listing_dealt['price']==0]
可以看到已经没有异常数据
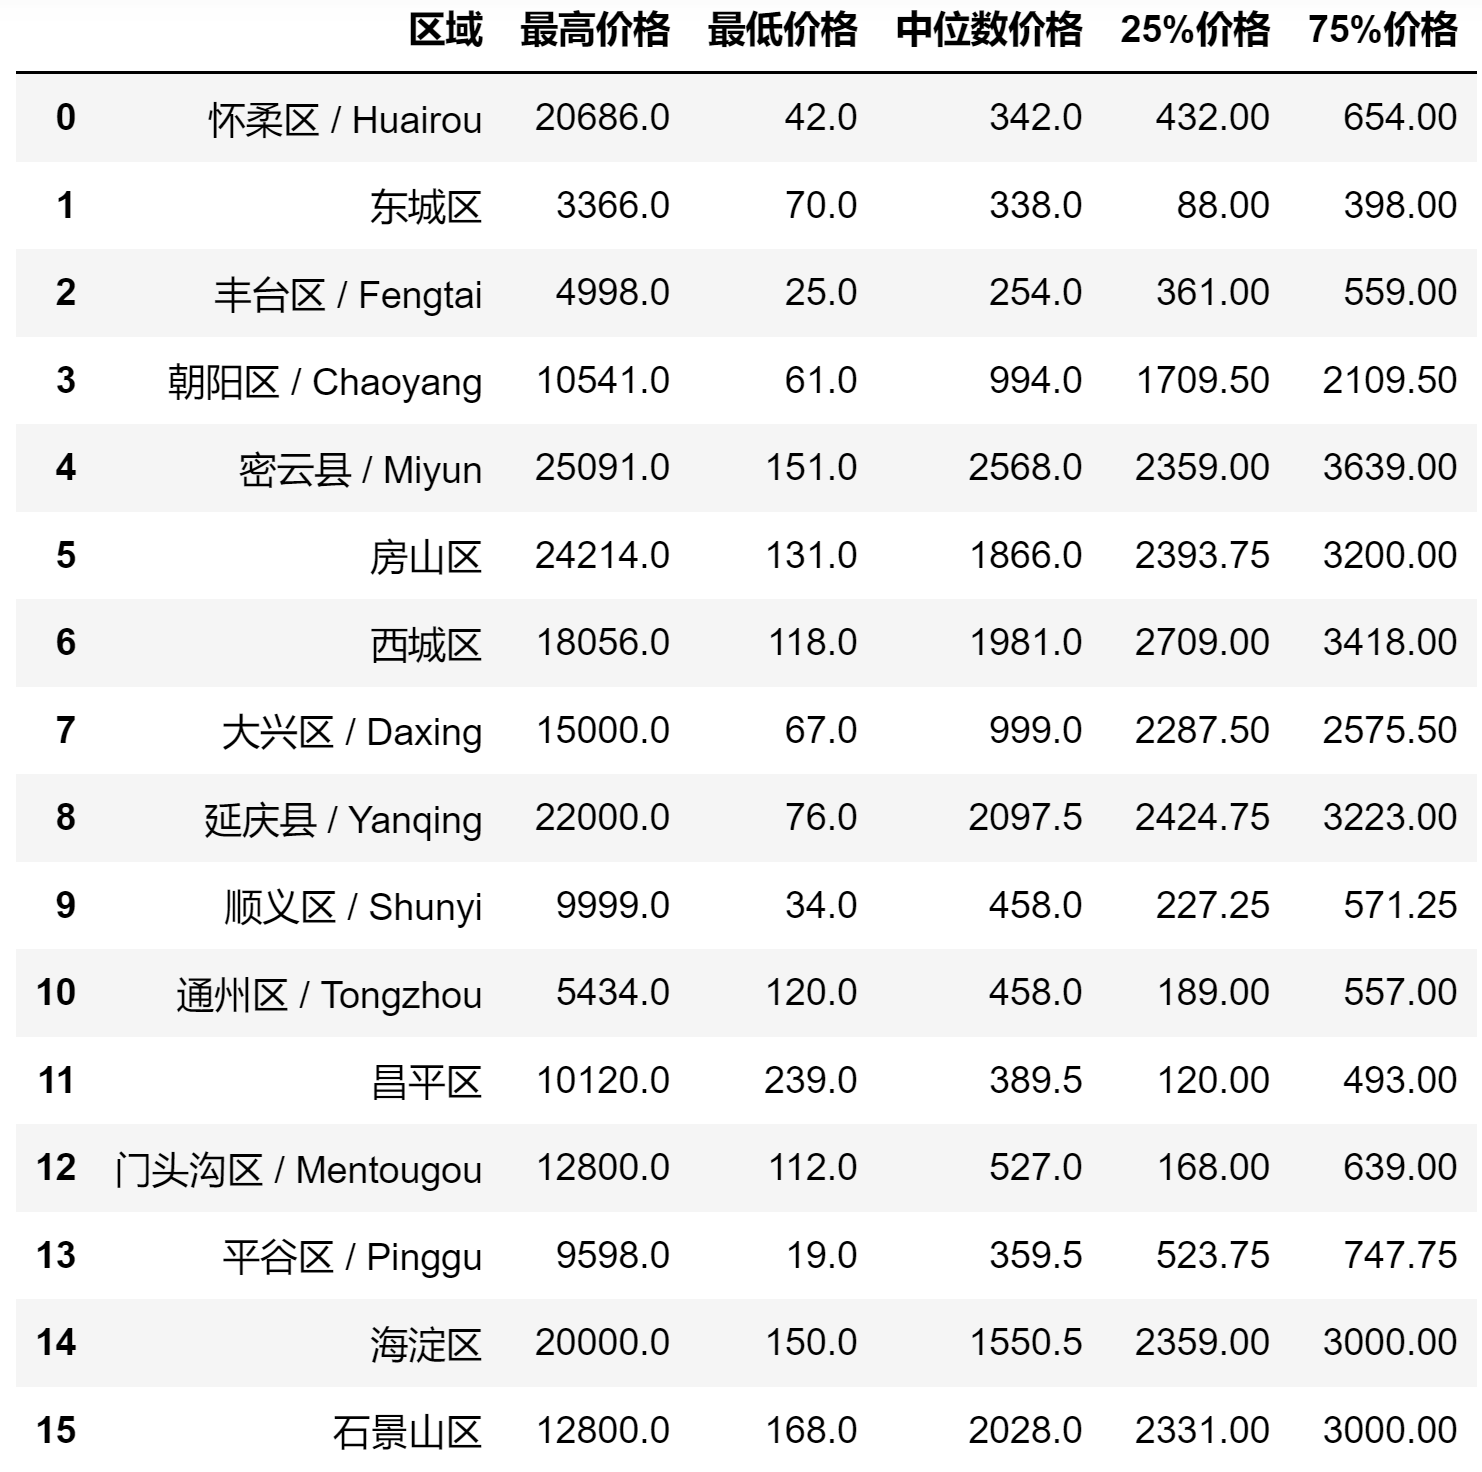
各区域价格统计
# 对各个区的价格进行可视化描述

b=pd.DataFrame(listing_dealt['neighbourhood_cleansed'].unique(),columns=['区域'])
b['最高价格']=listing_dealt[['price','neighbourhood_cleansed']].groupby('neighbourhood_cleansed').max().price.tolist()
b['最低价格']=listing_dealt[['price','neighbourhood_cleansed']].groupby('neighbourhood_cleansed').min().price.tolist()
b['中位数价格']=listing_dealt[['price','neighbourhood_cleansed']].groupby('neighbourhood_cleansed').median().price.tolist()
b['25%价格']=listing_dealt[['price','neighbourhood_cleansed']].groupby('neighbourhood_cleansed').quantile(0.25).price.tolist()
b['75%价格']=listing_dealt[['price','neighbourhood_cleansed']].groupby('neighbourhood_cleansed').quantile(0.75).price.tolist()
b['25%价格']=np.array(listing_dealt[['price','neighbourhood_cleansed']].groupby('neighbourhood_cleansed').quantile(0.75).price.tolist())-np.array(listing_dealt[['price','neighbourhood_cleansed']].groupby('neighbourhood_cleansed').quantile(0.25).price.tolist())
b
输出如下
可以看到其中密云、房山、海淀、西城、延庆的房价较高,与区域特征有关
民宿受欢迎关键词分析
找出受欢迎的民宿数据
数据集中包含有评论数,这里暂且将评论数作为入住人数,找出大于90分位的民宿数据作为受欢迎的民宿
首先获取90分位数值
avg_review = listing_dealt['number_of_reviews'].quantile(0.9)
avg_month_review = listing_dealt['reviews_per_month'].quantile(0.9)
print(avg_review)
print(avg_month_review)
然后根据数值找到受欢迎的民宿
popular_home = listing_dealt[(listing_dealt['number_of_reviews']>avg_review)&(listing_dealt['reviews_per_month']>avg_month_review)]
head10=popular_home.sort_values(by=['number_of_reviews','reviews_per_month'],ascending=False).head(10)
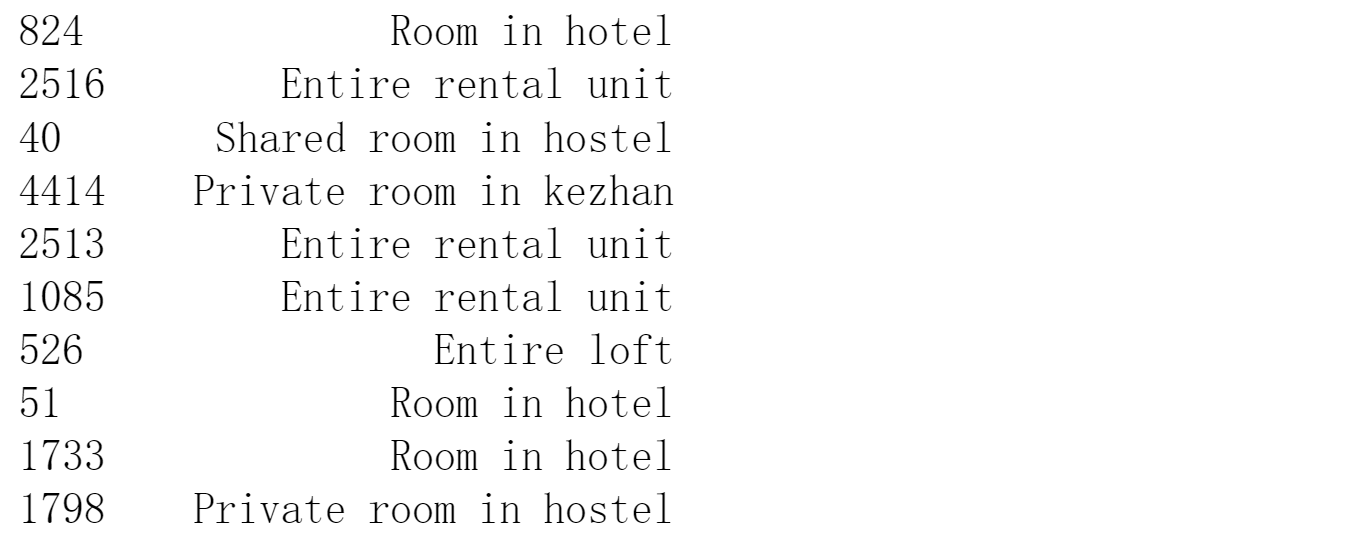
head10['property_type']
得到如下结论:
- 前10的受欢迎的民宿中大部分都是专业的运营团队,其名下不止一套房子,但是最大持有量也不超过11,这是由于在民宿行业并不会因为规模越大边际成本就越低,因为二房东去租十套房的租金并不会比租一套房的租金更低
- 前10的受欢迎的民宿中有4家民宿、6个旅馆,可以看到目前民宿与旅馆竞争激烈;其中仅有一家是合租,可以看出整租比起合租十分有优势
- 价格跨度比较大,在75美元到610美元之间;75美元是合租,大部分价格在300-500美元之间
关键词提取
首先需要对民宿数据的描述进行分词
import jieba

# 对描述进行分词

def jieba_cut(data):
    a=[]
    worddict={}
    with open('cn_stopwords.txt', encoding='utf8') as f:
        result=f.read().split()
    for i in data:
        words=jieba.lcut(i)
        word=[x for x in words if x not in result]
        a.extend(word)
    for word in a:
        worddict.setdefault(word,0)
        worddict[word]+=1
    return worddict
popular_words = jieba_cut(popular_home.name.astype('str'))
然后选取排名前十五的有意义的词
def deal_with_meanless_word(data):
    mean_words={}
    for i in data.keys():
        if len(i)>1:
            mean_words[i]=data[i]
    return mean_words
mean_words=deal_with_meanless_word(popular_words)
mean_words_df=pd.Series(mean_words).sort_values(ascending=False)
mean_words_df_top15=mean_words_df.head(15)
mean_words_df_top15
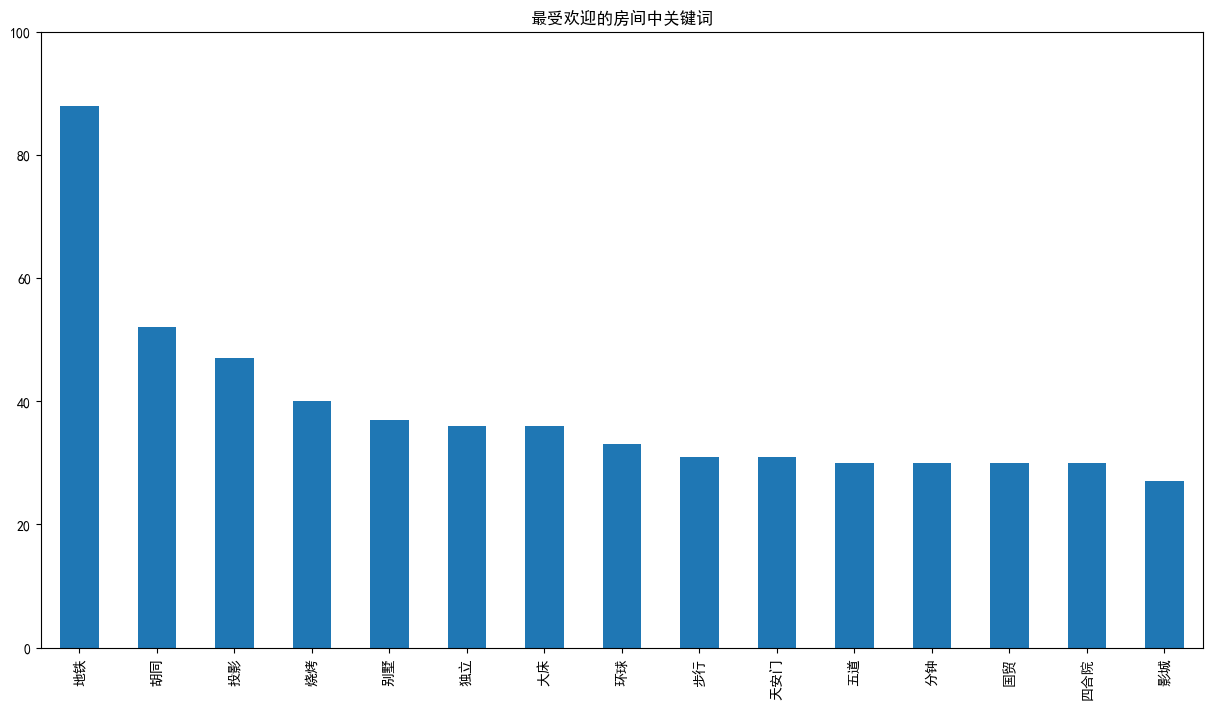
数据可视化
plt.figure(figsize=(15,8))
plt.title('最受欢迎的房间中关键词')
mean_words_df_top15.plot(kind='bar',ylim=[0,100])
生成词云
import re
from wordcloud import WordCloud
%pylab inline
%matplotlib inline

wordcloud_use=' '.join(mean_words_df.keys())
resultword=re.sub("[A-Za-z0-9\[\`\~\!\@\#\$\^\&\*\(\)\=\|\{\}\'\:\;\'\,\[\]\.\<\>\/\?\~\。\@\#\\\&\*\%]","",wordcloud_use)
w=WordCloud(scale=26,margin=3,background_color='white',font_path='simhei.ttf',max_words=200,max_font_size=50,random_state=20).generate(resultword)
f,axis=plt.subplots(figsize=(15,15))
plt.axis('off')
plt.imshow(w)
输出如下
得出结论
- 地铁毫无疑问排第一名,在当前社会地铁已经是一个城市最重要的公共交通设施,特别在北京这样的大都市,临近地铁成为房屋市场的重要决策因素
- 靠近景点和地标。如环球影城、欢乐谷、国贸、天安门等
- 民宿设施,如投影、露台、庭院等
- 总的来说,外部因素远比内部更重要,所以要如果需要开民宿,选址是第一位的
总结
通过对airbnb数据集的探索分析可以发现北京越靠近内环和旅游区,民宿数量越多。如果想要进入民宿行业发展,则在需要考虑的因素中,首先需要考虑交通、地理位置,其次需要对民宿进行现代化、风格化装修,同时民宿市场不宜进行大型投资,规模在5-20套房最佳
参考资料
airbnb公开数据集:http://insideairbnb.com/get-the-data/
pandas 数据类型转换:https://www.cnblogs.com/onemorepoint/p/9404753.html
python使用wordcloud分词及中文乱码解决:https://codeantenna.com/a/NGWPdoIvgK
ValueError: Number of rows must be a positive integer, not GridSpec...:https://stackoverflow.com/questions/63122387/valueerror-number-of-rows-must-be-a-positive-integer-not-gridspec2-1-height
中文常用停用词表:https://github.com/goto456/stopwords

